


Abstract
Genes of the mammalian major histocompatibility complex (MHC) are central to adaptive immunity. High levels of observed polymorphism at MHC loci have been hypothesized to be maintained by natural selection acting to preserve alleles for pathogen resistance. Here we examined patterns of multilocus MHC diversity in natural populations of 2 closely related carnivore species: spotted hyenas (Crocuta crocuta) and striped hyenas (Hyaena hyaena). We also tested hypotheses suggesting specific selection pressures favoring MHC diversity in these hyena species. We found several lines of evidence consistent with positive selection acting at multiple MHC loci in both species. These included high allelic variation, pervasive gene duplication, transspecies segregation of alleles, and codons evolving under positive selection that disproportionately map to known antigen-binding regions. Despite striking behavioral differences between these 2 hyaenids with respect to their mating systems and social behavior, we found no qualitative species differences in MHC loci, nor did we detect differences in the strength of natural selection. Our findings suggest that ancient shared selection pressures, including a common ancestral pattern of carrion feeding, has influenced MHC diversity more strongly in these hyena species than have selection pressures imposed relatively recently by sociality or sexual selection.
Variation among free-living mammals in their susceptibility to pathogens remains poorly understood. Among all mammals, carnivores are arguably the most threatened by pathogens (Pedersen et al. 2007), due in large part to anthropogenic disturbance. Characterization of the diversity of functionally relevant immune system genes can shed considerable light on both disease ecology in carnivores, and the relationship between their genetic diversity and immune function.
The major histocompatibility complex (MHC) is composed of functionally related and physically linked genes that are critical to the adaptive immune system. The subset of MHC genes termed “class II” present extracellular antigens to T cells in order to initiate an immune response, and are among the most diverse genes in the mammalian genome (Garrigan and Hedrick 2003; Gaudieri et al. 2000; Klein 1986). The high diversity observed at these loci is thought to represent an adaptation for recognizing and mounting an adaptive immune response to a wide array of rapidly evolving pathogens (reviewed in Garrigan and Hedrick 2003; Piertney and Oliver 2006; Sommer 2005).
Because of the integral role of these genes in the adaptive immune response, MHC diversity has been linked in various mammals to individual fitness and long-term survival of populations (e.g., Hughes 1991; Paterson et al. 1998; Penn 2002; Thoss et al. 2011). In fact, MHC has become a popular model for examining patterns of adaptive variation in vertebrates (reviewed in Bernatchez and Landry 2003; Piertney and Oliver 2006; Sommer 2005). Analyses of MHC polymorphism in nonmodel organisms offer opportunities to learn about immune system evolution in the wild, and provide insights into the role of genetic variation in long-term population viability. Here we characterize MHC diversity in 2 hyena species, spotted hyenas (Crocuta crocuta) and striped hyenas (Hyaena hyaena), and test hypotheses suggesting selective forces that may have shaped the evolution of this genetic diversity.
Several types of evidence support the hypothesis that MHC diversity is selectively maintained (e.g., Axtner and Sommer 2007; Bernatchez and Landry 2003; Bryja et al. 2006; Edwards and Hedrick 1998; Hughes and Nei 1992; Klein 1986; Richman 2000; Takahata 1995). First, selective maintenance of MHC diversity is suggested by high allelic variation. Second, selective maintenance of MHC diversity is indicated by substantial transspecies polymorphism, where allelic lineages are maintained over timescales that span speciation events; as a result, more closely related alleles are found among, rather than within, species (Figueroa et al. 1988; Klein et al. 1998). Selective maintenance of MHC diversity also is indicated by higher rates of nonsynonymous (dN) than synonymous (ds) nucleotide substitutions at codons responsible for antigen binding (antigen-binding sites—Hughes and Nei 1988, 1989; Klein 1986; Takahata and Nei 1990). Here we examine these phenomena to determine whether or not MHC diversity is maintained by selection in hyenas.
We characterized MHC diversity at 3 class II loci (DRB, DQB, and DQA) in spotted and striped hyenas, and compared the patterns of diversity at these MHC loci within and between these species to test for evidence of positive selection. We also addressed non–mutually exclusive hypotheses concerning selection pressures favoring MHC diversity in hyenas. High diversity at MHC loci is hypothesized to be maintained by pathogen-driven positive selection, acting through overdominance (heterozygote advantage) or negative frequency dependence (rare allele advantage), or both (Doherty and Zinkernagel 1975; Hedrick 1998; Hughes and Nei 1988, 1989; Hughes and Yeager 1998; Jeffery and Bangham 2000; Piertney and Oliver 2006; Potts and Slev 1995). Sexual selection also is thought to play a role in maintaining this diversity, by favoring MHC-based disassortative mating preferences via odor-based discrimination of MHC genotypes, or via selective abortion due to maternal–fetal incompatibility (Edwards and Hedrick 1998; Fernandez et al. 1999; Milinski 2006; Ober 1992; Penn and Potts 1998, 1999; Wedekind and Penn 2000; Wedekind et al. 1995; Yamazaki et al. 1999). In addition, sociality has been found to influence strength of selection at MHC loci, with evidence of stronger selection in more gregarious species imposed by higher rates of contact among conspecifics (Hambuch and Lacey 2002; Kundu and Faulkes 2003). Previous studies also have demonstrated a strong link between degree of sociality and rates of parasite transmission, and subsequent selection for increased disease resistance in gregarious host species (Altizer et al. 2003; Bull 1994; Frank 1996; Møller et al. 2001; Nunn et al. 2008). Here, we consider these possibilities in regard to hyenas.
Spotted and striped hyenas belong to a clade morphologically specialized for feeding on carrion, with strong jaws and massive crania adapted for durophagy (Tanner et al. 2008; Werdelin and Solounias 1991). Whereas all carnivores are exposed to pathogens through their prey, hyenas are potentially exposed to higher pathogen concentrations, and to a greater diversity of pathogens, than sympatric carnivores, due to their regular consumption of carrion (e.g., Boone et al. 2009; Getz 2011; Gortázar et al. 2010; Holekamp and Dloniak 2010; Jennelle et al. 2009; Reperant et al. 2008; Wilson and Wolkovich 2011). This is the 1st of several reasons why analysis of MHC diversity among hyaenids is particularly interesting.
Second, whereas nonhyaenid carnivores in Africa are known to suffer high mortality rates from various infectious diseases (e.g., rabies [Kat et al. 1995; Maas 1993] and canine distemper virus [Carpenter et al. 1998; Roelke-Parker et al. 1996; van de Bildt et al. 2002]), spotted hyenas seldom exhibit symptoms of infection, and disease-induced mortality is surprisingly rare, despite evidence for infection rates comparable to those documented in sympatric carnivores (East et al. 2001; Haas et al. 1996; Murray et al. 1999; but see Mills 1990). Natural populations of spotted hyenas host a wide array of pathogens, ranging from viruses to macroparasites (East et al. 2001; Engh et al. 2003; Haas et al. 1996; Harrison et al. 2004), and striped hyenas are known to be affected by at least a subset of the same infectious agents (e.g., Samuel et al. 2001). Little is known about mortality sources in striped hyenas, but no evidence exists of massive disease mortality among them. Low disease mortality and carrion feeding suggest that immune function in bone-cracking hyenas might be unusually robust. If pathogens encountered during carrion feeding represent an important source of selection driving diversity in MHC loci in hyena species, then we would expect spotted and striped hyenas to exhibit similar patterns of diversity at MHC loci, because they are both recently descended from carrion-feeding ancestors (Werdelin and Solounias 1991) and both species regularly eat carrion (Kruuk 1972, 1976).
Although both hyena species examined here consume substantial amounts of carrion, other aspects of their behavioral ecology differ dramatically. Spotted hyenas live in large fission–fusion groups, called “clans,” that contain up to 98 individuals; within clans there is intense direct competition for food at kills and clan members frequently cooperate to defend carcasses against sympatric carnivores (Boydston et al. 2001; Holekamp et al. 2012; Smith et al. 2008). In contrast, striped hyenas live alone or in small family groups, feed solitarily, and avoid close contact with sympatric carnivores (Kruuk 1976; Macdonald 1978; Wagner et al. 2008).
Chemical communication via scent marking is well documented in both hyena species, and earlier work indicates that these scent cues convey information about relatedness and individual identity (e.g., Burgener et al. 2009; Drea et al. 2002; Kruuk 1976; Mills 1990; Theis 2008). Given the significant role of chemical communication in both species, it is possible that MHC-mediated odor cues are used by hyenas in mate-choice decisions. If MHC diversity in offspring influences the fitness of their mothers, then females should choose mates that offer optimal MHC diversity for their offspring. However, mating systems differ markedly between the 2 hyena species.
The spotted hyena is unique among mammals in that many aspects of the female's morphology and behavior are heavily “masculinized.” Female spotted hyenas are socially dominant to all adult immigrant males within a clan, and possess masculinized genitalia that preclude forced copulation (East et al. 1993; Frank et al. 1995; Holekamp et al. 2012; Kruuk 1972). These traits suggest that female mate choice is absolute in the spotted hyena. In contrast to spotted hyenas, striped hyenas show neither behavioral sex-role reversals, nor any unusual traits expressed in the adult genitalia (Holekamp and Kolowski 2009; Wagner et al. 2007b). The unique “role-reversed” traits of female spotted hyenas, together with larger group sizes and higher interaction rates with conspecifics, indicate that intersexual selection is likely to be stronger in spotted hyenas than in striped hyenas. If intersexual selection affects MHC diversity, we would therefore expect to see differences between these 2 species in degree of MHC polymorphism.
If pathogen pressure mediated by social behavior in hyenas represents a stronger selective force acting on MHC loci in hyenas than that imposed by shared ancestry, we would expect to see greater MHC diversity, and evidence of stronger selection, in spotted hyenas than in striped hyenas. If genetic drift is the predominant force shaping levels of genetic diversity, we also would expect to see higher levels of genetic diversity in spotted hyenas than in striped hyenas, because the gregarious spotted hyena has a much larger effective population size than does the solitary striped hyena (Mills and Hofer 1998).
Currently, no information exists regarding MHC sequence variation among hyaenids. Here we describe variation at 3 MHC loci in spotted and striped hyenas using genetic material collected from free-living animals in Kenya. We investigate the evolution of these genes by testing for signatures of historical positive selection. We also inquire whether observed patterns of MHC diversity in spotted and striped hyenas are more consistent with selection pressures imposed by pathogen exposure via a shared evolutionary history or by recently evolved differences between these 2 species with respect to their social systems and reproductive biology.
Materials and Methods
Study subjects.—All sampled spotted hyenas were wild animals living in and around the Masai Mara Game Reserve in Narok District, Kenya, and all sampled striped hyenas were wild animals living in Laikipia District, Kenya. All sampling procedures were approved by the Institutional Animal Care and Use Committee at Michigan State University (animal research protocol AUF 07/08-099-00 approved most recently on 4 June 2010). Our methods met guidelines approved by the American Society of Mammalogists (Sikes et al. 2011) and comply with Kenyan Law. All samples were collected from both sites between 1996 and 2009. Methods used to capture animals and collect blood samples used to extract DNA are described in detail in Engh et al. (2002) and Wagner et al. (2007a). In order to obtain a representative sample of alleles for a population from each species, we characterized diversity in a sample of 20 individuals of each species at 3 loci and sequenced individual clones to identify alleles (see below).
To evaluate relatedness within the sample set for each species, all samples were genotyped at 10 (in spotted hyenas) and 8 (in striped hyenas) microsatellite loci as previously described (Van Horn et al. 2004; Wagner et al. 2007a; Watts et al. 2011), and pairwise relatedness values (R) were estimated using the program RELATEDNESS (Queller and Goodnight 1989).
Characterizing MHC variation.—We focused on regions of functional class II MHC loci that have previously been reported to contain antigen-binding regions; these are highly polymorphic sites known to be involved in antigen presentation (Hughes and Nei 1988, 1989; Klein 1986). We polymerase chain reaction–amplified loci of 198 base pairs (bp), 195 bp, and 222 bp in length from DRB exon 2, DQB, and DQA, respectively. DNA was extracted from blood and tissue samples using Gentra Puregene kits (Gentra Systems D-5000; Gentra Systems, Inc., Minneapolis, Minnesota) or Qiagen DNeasy Blood and Tissue kits (Qiagen 69506; Qiagen, Valencia, California). Each DNA extract was amplified via polymerase chain reaction using the primers MspDRBF, MspDRBR, MspDQBF, MspDQBR, MspDQAF, and MspDQAR, which were designed from a multispecies alignment (Table 1). All putative alleles were subjected to BLASTP and TBLASTN similarity searches on the National Center for Biotechnology Information (NCBI) website (Geer et al. 2010) in vertebrates, which yielded reciprocal best matches that correctly differentiated alleles among the putative targeted loci of DRB, DQB, and DQA. These results support gene orthology among the 3 loci and we therefore refer to these regions as DRB, DQB, and DQA, respectively. All sequences were deposited in GenBank (Geer et al. 2010) (accession numbers HQ230582, HQ230583, HQ230586, HQ230587, HQ230598, HQ230640, HQ230642, HQ230643, HQ230647, HQ230655, HQ230671, HQ230672, HQ230684, HQ230726, HQ230734, HQ230742, HQ230750, HQ230766, and JN985739–JN985781).
Primer sets, sequences, and annealing temperatures (Tas) used to amplify regions of 3 major histocompatibility complex genes (DRB, DQB, and DQA) in spotted (Crocuta crocutd) and striped (Hyaena hyaena) hyenas.
| Primer name | Primer sequence (5′ to 3′) | Ta (°C) |
|---|---|---|
| MspDRBF | AAC GGG ACR GAG CRG GTG CG | 47 |
| MspDRBR | ACA CCG TAG TTG TGT CTG CA | 47 |
| MspDQBF | YTT CAC CAA CGG GAC GGA GCG | 56 |
| MspDQBR | TTG TGT CTG CAC ACC GTG TCC A | 56 |
| MspDQAF | TGG CCA GTA CAC CCA TGA ATT TGA TG | 49 |
| MspDQAR | AAG AGA GGC AGA ATG GTR RAC | 49 |
Sequencing indicated multiple alleles at all loci and putative gene duplication at all 3 loci; accordingly we sequenced multiple clones from each individual at all loci. We recovered more than 2 alleles per individual at all MHC loci sampled and therefore assume the existence of paralogs for each locus. Importantly, assignment of alleles to each of these loci was unequivocal. We were able to recover singleton alleles by random resequencing of independent polymerase chain reactions and cloning reactions from a subset of individuals, indicating that rare alleles were not due to polymerase chain reaction error. However, to be conservative, all singleton alleles were removed from all intraspecific analyses presented here. Alleles that were shared by both species (i.e., no longer singletons) were included in interspecific analyses. The criteria used to define a sequence as a true allele were based on its occurrence in at least 2 independent polymerase chain reactions derived from different individuals, or at least 3 independent polymerase chain reactions derived from the same individual. This cloning approach and pervasive duplication prevented us from estimating allele frequencies, but did allow us to determine minimum levels of diversity and assess historical relationships among the sampled alleles.
For each individual sampled, 3 independent polymerase chain reaction products per locus were combined for subsequent cloning and sequencing analyses. Polymerase chain reactions were prepared in 20-µl volumes including 375 µM of each deoxynucleoside triphosphate, 10 pmol of each primer, and 1 U of Go Taq DNA polymerase (Promega Corporation, Madison, Wisconsin). Thermal cycling conditions were: 95°C for 2 min; 40 cycles of 95°C for 5 s, annealing temperature for 5 s, 72°C for 5 s; and 72°C for 10 min (annealing temperatures are given in Table 1). Mixed polymerase chain reaction products were cloned using the pGEM-T Easy kit (Promega Corporation) following the manufacturer's recommendations. Using an automated sequencer at the Research Technology Support Facility at Michigan State University, we sequenced an average of 9.6 (±0.2 SE) clones per locus in each individual animal (means of 9.9 ± 0.3 in spotted hyenas and 9.3 ± 0.2 in striped hyenas) to provide a minimum estimate of allelic diversity.
Population genetics, phylogenetic analyses, and codon models of selection.—We calculated rates of nonsynonymous (dN) and synonymous (ds) substitutions using distance-based methods in DnaSP version 5 (Librado and Rozas 2009). However, because inferring selection from distance-based measures of dNdS can be problematic (e.g., Kryazhimskiy and Plotkin 2008), here we utilize Bayesian methods implemented in codeML within the PAML 4 software package (Yang 2007). Using these methods, we obtained measures of the selection parameter ω, which measures the ratio between nonsynonymous (dN) and synonymous (dS) substitutions per site. A ratio of ω > 1 (or an excess of nonsynonymous substitutions relative to synonymous substitutions) indicates positive selection, whereas a ratio of ω < 1 indicates purifying selection, and a ratio of ω = 0 results in a failure to reject neutrality at the codons in question. Maximum-likelihood methods have been widely used to test for the presence of codons affected by positive selection and to identify those sites. We compared 5 codon-based models of sequence evolution (M0, M1a, M2a, M7, and M8). The M0 model assumes 1 ω (dN/dS) ratio for all sites; the nearly neutral model, M1a, assumes a proportion (p0) of sites evolving at ω < 1 and the rest (p1) at ω1 = 1; and the selection model, M2a, adds an additional class of sites to the M1a model that are evolving at ω2 > 1, where ω2 is estimated from the data. M7 and M8 are extensions of M1a and M2a that include variation in ω according to a beta-distributed pattern of substitution rates. The best-fitting model was chosen on the basis of likelihood-ratio tests and Akaike's information criterion (AIC—Posada and Buckley 2004; Sullivan and Joyce 2005). Both methods agreed on the choice of the best-fitting model in all cases. Positively selected codons were identified through the Bayes empirical Bayes procedure (Zhang et al. 2005).
Because recombination within sequences can lead to false identification of positive selection (Anisimova et al. 2003), we screened for the presence of recombination using the program “permute” to calculate 3 common measures of linkage disequilibrium: r2, D′, and G4 (Wilson and McVean 2006). Given evidence indicating the presence of recombination, we then used omegaMap version 5.0 to perform a Bayesian inference of codon specific ω, which may alleviate potential biases in the calculation of ω with the presence of recombination (Wilson and McVean 2006). Two independent analyses were run for 2 sets of uninformative priors (improper inverse and inverse), which follows suggestions contained in the program documentation. We ran each prior with 2 sets of codon frequencies, 1 assuming equal frequencies and 1 using codon frequencies estimated from genomic feline and canine codon frequencies, which were similar to each other and represented the sequenced genomes that are most closely related to hyenas. For each codon frequency, we ran 2 sets of starting values, and 2 replications of each of these starting values to validate convergence. Two Markov chain Monte Carlo runs were performed, each with 500,000 iterations. The first 10% of iterations were discarded as burn-in. These results were compared to results obtained from PAML.
Phylogenies were constructed for all 3 loci using likelihood-based methods in PhyML 3.0 (Guindon and Gascuel 2003), and the Bayesian approach implemented in MRBAYES 3.1 (Huelsenbeck and Ronquist 2001). Topologies estimated from all methods of analysis were highly concordant. The likelihood based model used for phylogenetic reconstruction was the “GTR + Γ + gamma distributed rates” model, and all parameter values were estimated from the data. Tree search algorithms utilized subtree pruning and regrafting plus nearest-neighbor interchange branch swapping and branch support was determined with 1,000 bootstrap replicates. For Bayesian analyses, we again used the same substitution model as used for likelihood, as well as default prior values. Two independent runs of 4 Metropolis coupled Markov chain Monte Carlo simulations (3 of them “heated”) were each run for 2 × 10⁷ generations and sampled every 100 generations. Convergence was assessed by checking that the average standard deviation of split frequencies in MRBAYES was less than 0.01 early in each run, by verifying a lack of pattern in the residuals of the parameter estimates over generations, and because 2 independent runs were compared and found to have identical topologies. The first 4 × 10⁵ trees were discarded as burn-in, resulting in 1.2 × 10⁶ sampled trees. To calculate the posterior probability of each bipartition, the majority-rule consensus tree was computed from the sampled trees.
Results
Pairwise relatedness and allelic diversity.—Analyses of microsatellite data revealed low average pairwise relatedness (R) values among both spotted and striped hyenas (R = 0.03 ± 0.03 SE and R = 0.05 ± 0.02, respectively). No differences were observed between species in R (t = −0.033, P > 0.1), mean number of alleles at microsatellite loci (spotted = 4.75 ± 0.65; striped = 4.80 ± 0.59; t = 0.057; P > 0.1), or average microsatellite observed heterozygosity (HO; spotted = 0.59 ± 0.06; striped = 0.51 ± 0.08; t = 0.822; P > 0.1).
We observed high allelic and nucleotide diversity at all 3 MHC loci in both hyena species (Table 2). Alleles that had been discarded as singletons for intraspecies analysis were reinserted into the data set used for interspecies analysis when these alleles were shared between the 2 species (i.e., were no longer singletons). Four alleles (2 spotted DRB alleles, 1 striped DQB allele, and 1 striped hyena DQA allele) identified in our initial survey showed signs of nonfunctionality, containing premature stop codons. Some of these were the result of frameshift mutations, and we concluded that these alleles represent putative pseudogenes. All 4 of these alleles were eliminated from subsequent analyses. Nucleotide diversity, as estimated from the parameter pi (π—Nei and Li 1979), ranged from 0.003 at the DQA locus in striped hyenas to 0.135 at the DQB locus in striped hyenas (Table 2). The values of nucleotide diversity reported in Table 2 did not differ significantly between spotted and striped hyenas at any of the 3 loci examined (ͼ2: for all loci, P > 0.05). For intraspecific comparisons among alleles, we observed average, distance-based, ratios of nonsynonymous (dN) to synonymous (dS) substitution rates among alleles at each locus that exceeded 1.0. These values did not differ significantly between the 2 species at any locus (Wilcoxon rank sum test: for all loci, P > 0.05). Thus, all our estimates of dN/dS were consistent with the action of positive selection (Table 2).
Allelic diversity in spotted (Crocuta crocuta) and striped (Hyaena hyaena) hyenas within regions of 3 major histocompatibility complex loci (DRB, DQB, and DQA).
| Locus | |||
|---|---|---|---|
| Species | DRB | DQB | DQA |
| Total no. alleles | |||
| Spotteda | 26 (0.054) | 9 (0.098) | 4 (0.006) |
| Striped | 18 (0.053) | 7 (0.135) | 5 (0.003) |
| Both speciesb | 33 (0.055) | 14 (0.104) | 10 (0.008) |
| Average dN/dsc | |||
| Spotted | 1.4 | 1.5 | 1.5 |
| Striped | 1.7 | 1.5 | 1.5 |
| Average no. alleles/individual | |||
| Spotted | 4.7 | 2.4 | 2.9 |
| Striped | 6.1 | 2.1 | 5.1 |
n = 20 individuals sampled for both species at all loci; nucleotide diversity (π) is given in parentheses after allele numbers.
Singleton alleles added back to analysis when they occurred in both species (i.e., no longer singletons).
Distance-based estimates of ratio between nonsynonymous (dN) and synonymous (dS) substitutions (dN/dS) among all alleles within each species.
Gene duplication.—Our method of sequencing multiple clones from independent polymerase chain reactions led to the discovery of more than 2 alleles per locus in 70% of individuals examined (97.5% at DRB, 82.5% at DQB, and 30% at DQA, after removing singleton alleles). Multiple gene copies for MHC loci have been verified in several mammals for which relatively thorough genomic assemblies and gene annotations are available (e.g., Axtner and Sommer et al. 2007; Barbisan et al. 2009; Bryja et al. 2006; Yang and Yu 2000), although population-based studies have tended to focus on loci that segregate in a bi-allelic fashion. In the most extreme cases observed here, 7 and 8 DRB alleles were identified in individual spotted and striped hyenas, respectively. If we conservatively assume heterozygosity at all loci, this indicates a minimum of 4 paralogs at the DRB locus in both hyena species.
Transspecies allelism.—Given the high numbers of alleles found per individual, and evidence of paralogs at each of the 3 loci, we next inquired whether the alleles were recently evolved (monophyletic clades of alleles for each species), or whether alleles have been segregating for much longer periods of time (polyphyletic clades of alleles among species). Bayesian and likelihood-based phylogenies of alleles from both species were polyphyletic for each of the 3 loci (Fig. 1), demonstrating transspecies polymorphism. Maximum-likelihood and Bayesian approaches yielded concordant results, but for simplicity, only results from Bayesian phylogenetic analyses are shown. We identified shared, or transspecies polymorphisms, which indicate that some of these alleles have been maintained since before striped and spotted hyenas last shared a common ancestor. Because we found no clear evolutionary delineation between these 2 species at any locus, data for both species were combined for subsequent analysis. Average branch lengths (DRB: spotted: 0.09 ± 0.02 SE, striped: 0.08 ± 0.02; DQB: spotted: 0.03 ± 0.01, striped: 0.05 ± 0.01; DQA: spotted: 0.1 ± 0.001, striped: 0.1 ± 0.001) of tree topology did not change significantly when the species were analyzed separately (Wilcoxon rank sum test to compare average branch lengths: for all loci, P > 0.1), indicating that the shape of tree topologies were not significantly different between species.
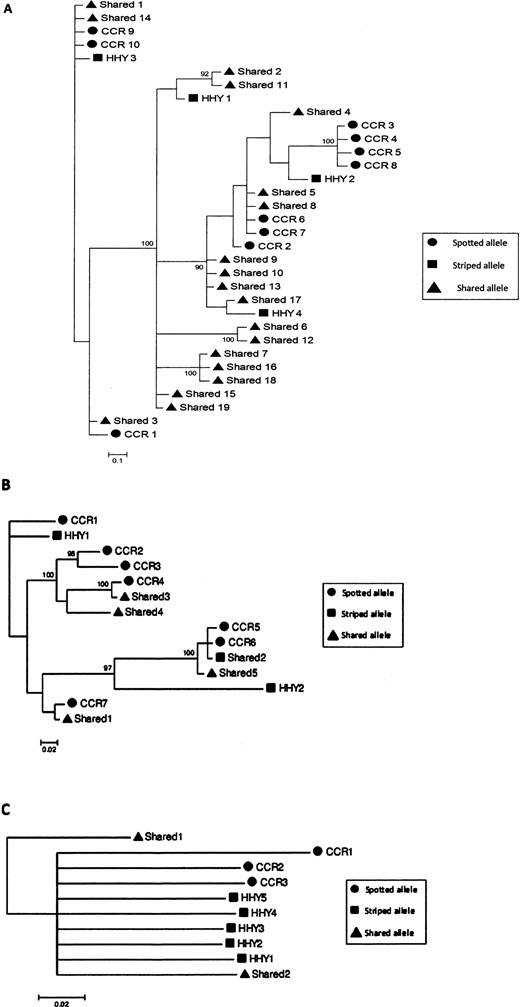
Unrooted phylograms based on nucleotide sequences of spotted and striped hyena major histocompatibility complex loci A) DRB, B) DQB, and C) DQA. Bayesian posterior probabilities above 90% are shown along their respective branches. Circles represent spotted hyena (CCR) alleles, squares represent striped hyena (HHY) alleles, and triangles represent alleles present in both hyena species (Shared). The scale bar accompanying each phylogram indicates the rate of substitutions per site.
Positive selection and rapid evolution.—In order to test more formally whether rates of evolution were consistent with positive selection, we performed sites-based tests of selection using codon models of evolution as implemented in PAML 4 (Yang 2007). Likelihood ratio tests and AIC values revealed that, for the DRB and DQB loci, codon evolution models that incorporate positive selection fit the data significantly better than models that did not (Table 3). M2a and M8 had similar likelihood scores, but because M8 has more parameters than M2a, M2a (the selection model) was the most-parsimonious model explaining our data. High proportions of sites were identified as evolving rapidly at 2 loci: 14.6% of sites within DRB evolving at ω = 5.36, and 13.9% of sites within DQB evolving at ω = 4.89 (Table 3). The majority of the remaining sites at each locus (76.2% at DRB and 68.7% at DQB) were identified as evolving under purifying selection (ω < 1). For the DQA locus, 1 rate of evolution was sufficient to explain the observed pattern within hyenas, because adding more than 1 rate did not improve the fit of the model. Using the Bayes empirical Bayes approach implemented in PAML, 8 codons within DRB and 3 codons within DQB were identified with high posterior probability (probability ≥0.95) as evolving under positive selection (Fig. 2). We determined putative antigen-binding sites for DRB and DQB based on homology with previously identified functional sites (Brown et al. 1993; Mikko et al. 1999; Yuhki et al. 2008). Of the 8 sites predicted to be evolving under positive selection within DRB, 5 occurred within putative antigen-binding sites (Fig. 2; Yuhki et al. 2008). Within DQB, 6 codons were identified as being subject to positive selection, and 4 of these occurred at antigen-binding sites (Fig. 2; Brown et al. 1993; Mikko et al. 1999). When alleles from each species were analyzed separately, a high proportion of sites were still predicted to be under positive selection at DRB and DQB, and the location of sites predicted to be under selection did not differ between species (data not shown).
![Multiple sequence alignment of A) DRB and B) DQB. Sites predicted to be under positive selection (probability ≥0.95) in both spotted (Crocuta crocutd) and striped (Hyaena hyaena) hyenas identified by the Bayes empirical Bayes (BEB) procedure of the PAML package are indicated by a capital letter “P” below the sequence alignment. Additional sites predicted to be under selection (posterior probability ≥0.95) in both hyena species identified by omegaMap are indicated by a capital letter “O” below the sequence alignment. Sites that both PAML and omegaMap identified as sites under positive selection are indicated by an asterisk (*). Putative antigen recognition sites (from Yuhki et al. 2008 [DRB] and after Brown et al. 1993 as shown by Mikko et al. 1999 [DQB]) are shaded in gray.](https://oup.silverchair-cdn.com/oup/backfile/Content_public/Journal/jmammal/94/2/10.1644/12-MAMM-A-054.1/2/m_jmammal-94-2-282-fig2.jpeg?Expires=1716421131&Signature=EqXtYeQZu9N9sPmKVlEmDY2C1HKvKcOzmklx4WNkfVZrSE5jYE4oj-tPawNNx~dskUmDvKTPHCJr~VLe-9blsgC5iQRTRoK0RjwIu8eheKcy9IYHiHj~tzj8yVKcTNpw5rDdmvdLYL4Ci5d4NOJW~Mc8mrn8Um2BPghKOb~8pP7IiXBrgeoieN7XnjkLM~9LNVPoETC7gbgtg~5~wTu1mmFtrlnJrB~VZm0qD9cWl2dqMk4P7L6MAa3L6Y7nDrXHQue-fNSlJmrFPwU8Akw2pz5q5FTsFL5Rd-Tt8xpzCVbwZuXXAhsD-TUf6-IMa4GclVayk7dNecOgIl~7HEmdnA__&Key-Pair-Id=APKAIE5G5CRDK6RD3PGA)
Multiple sequence alignment of A) DRB and B) DQB. Sites predicted to be under positive selection (probability ≥0.95) in both spotted (Crocuta crocutd) and striped (Hyaena hyaena) hyenas identified by the Bayes empirical Bayes (BEB) procedure of the PAML package are indicated by a capital letter “P” below the sequence alignment. Additional sites predicted to be under selection (posterior probability ≥0.95) in both hyena species identified by omegaMap are indicated by a capital letter “O” below the sequence alignment. Sites that both PAML and omegaMap identified as sites under positive selection are indicated by an asterisk (*). Putative antigen recognition sites (from Yuhki et al. 2008 [DRB] and after Brown et al. 1993 as shown by Mikko et al. 1999 [DQB]) are shaded in gray.
Evaluation of codon-based evolution models indicates positive selection acting at 3 major histocompatibility complex loci in hyenas. Model of best fit (P < 0.001) is indicated with an asterisk (*). Estimated proportions of sites (px) evolving at corresponding estimated rates (ωx=dN/dS) are given in the parameters column, dN/dS = ratio between nonsynonymous (dN) and synonymous (dS) substitutions; NA = not applicable.
| Modela | In Lb | ΔAIC | Parametersc |
|---|---|---|---|
| DRB all unique alleles; both species | |||
| M0—1 ω | −1,376.3 | 513.86 | ω = 0.78 |
| M1a—nearly neutral (ω0 < 1, ω1 = 1) | −1,157.5 | 78.39 | p0 = 0.769, ω0 = 0.0 |
| M2a—positive selection (ω0 < 1, ω1 = 1, ω2 > 1) | −1,116.3 | Best* | P0 = 0.762, p2 = 0.146, ω0 = 0.007, ω2 = 5.3 |
| M7—beta (p, q) | −1,158.1 | 79.44 | p = 0.008, q = 0.028 |
| M8—beta and ω (p, q, ωs > 1) | 1,116.6 | 0.56 | P0 = 0.853, (p1 = 0.147), p = 0.009, q = 0.064, ω =5.37 |
| DQB all unique alleles; both species | |||
| M0—1 ω | −1,148.4 | 292.8 | ω = 0.410 |
| M1a—nearly neutral (ω0 < 1, ω1 = 1) | −1,021.8 | 41.6 | P0 = 0.701, ω0 = 0.02 |
| M2a—positive selection (ω0 < 1, ω1 = 1, ω2>l) | −999.03 | Best* | P0 = 0.687, p2 = 0.139, ω0 = 0.03, ω2 = 4.89 |
| M7—beta (p, q) | −1,022.1 | 42.2 | p = 0.082, q = 0.209 |
| M8—beta and ω (p, q, ωs > 1) | −1,000.3 | 2.7 | P0 = 0.855, (p1 = 0.145), p = 0.09, q = 0.343, ω = 4.46 |
| DQA all unique alleles; both species | |||
| M0—1 ω | −356.3 | 35.8 | ω = 4.575 |
| M1a—nearly neutral (ω0 < 1, ω1 = 1) | −357.2 | 39.6 | P0 = 0.499, ω0 = 0 |
| M2a—positive selection (ω0 < 1, ω1 = 1, ω2>l) | NA | NA | NA |
Alternative sites based models of codon evolution from PAML 4 (Yang 2007).
Log-likelihood score.
Proportion of sites (p) evolving at corresponding rate (ω).
We found evidence for intragenic recombination at 2 loci in both hyena species (DRB: r2, D′, G4, all P < 0.001; DQB: r2, D′, G4, all P < 0.01). The omegaMap results were largely consistent with the PAML results (Fig. 2). Here we present results from the improper inverse prior, using codon frequencies estimated from felids; we chose to report these results because the improper inverse does not force initial parameter values to be defined, as does the inverse prior, and based on limited sequence data, hyenas exhibit codon bias similar to that in other carnivores. Summaries of all analyses are available online (Supporting Information S1 and S2, DOI: 10.1644/504. S1 and DOI: 10.1644/504.S2). Eight sites at DRB and 9 sites at DQB were predicted to be under selection with a 95% or higher posterior probability by omegaMap, compared with 8 and 6 sites for DRB and DQB, respectively, called by PAML. Of the sites predicted to be under positive selection by omegaMap, 6 (75%) of 8 DRB sites, and 5 (55.6%) of 9 DQB sites, corresponded to putative antigen-binding sites (Fig. 2). There was 62.5% and 55.6% agreement of the identity of these positively selected sites between PAML and omegaMap at DRB and at DQB, respectively. Of the sites predicted to be under positive selection by both omegaMap and PAML, 60% of sites (3 of 5 sites) at both loci overlap with putative antigen-binding sites (Fig. 2).
Discussion
Our study is among the 1st analyses of MHC diversity in wild populations of carnivores (Hedrick et al. 2003; Siddle et al. 2007; Soll et al. 2005; Yoshiki et al. 2010). We have reported several lines of evidence consistent with positive selection acting on MHC loci in both species of hyenas: high allelic variation, pervasive gene duplication, transspecies polymorphisms, and dN/dS values greater than 1.0 at codons that correspond to known functional sites. In contrast to previous comparative studies in other taxa, despite the marked differences in mating system and sociality between the 2 species, here we found no strong differences in the extent or evolutionary patterns of MHC diversity between spotted and striped hyenas. Examination of our data suggests that a shared evolutionary history, rather than behavioral and ecological differences between species, may have been the primary factor accounting for the observed patterns of MHC variation in hyenas.
Patterns of allelic variation and evidence for selection.— The high levels of diversity we found in both hyena species are consistent with previous studies of MHC loci in mammals (e.g., Kennedy et al. 2005; O'Brien and Yuhki 1999; Schwensow et al. 2010; van Haeringen et al. 1999; Worley et al. 2006). High MHC diversity is often interpreted as resulting from selection acting to increase variation (e.g., Apanius et al. 1997; Blais et al. 2007; Hughes and Yeager 1998; Ohta 1991). Most MHC-related studies in nonmodel species face the problem of lacking detailed genomic information, as we do here, and this has precluded accurate assignments of the observed sequences to specific paralogous loci. Although we could not discriminate between orthology and paralogy within each locus, we could unequivocally ascribe each allele to the appropriate gene (DRB versus DQB versus DQA). Despite multiple paralogs for each of the 3 genes, we were able to infer that positive selection has been acting, on average, at functionally important codons over the history of these genes. Large proportions of sites corresponding to known antigen-binding sites were predicted to be under positive selection (14.6% at DRB and 13.9% at DQB [Fig. 2; Table 3]), with a substantial remainder of sites under negative, or purifying, selection (ω < 1; 76.2% at DRB and 68.7% at DQB). Our approach has allowed us to estimate a minimum number of alleles for each of the 3 genes, but we most likely failed to recover all rare alleles. Thus, we suspect that the number of alleles reported here represents a conservative estimate.
There have been few MHC studies conducted in free-ranging carnivore populations, and none previously in hyaenids, which makes inferences from comparative biology difficult. However, other carnivores are known to have lower numbers of paralogs per MHC locus than observed here in either hyena species, suggesting that the high gene copy number found here may have originated in the hyena lineage (e.g., Drake et al. 2004; Hedrick et al. 2000, 2003; O'Brien and Yuhki 1999; Wang et al. 2009). Further, both hyena species appear to show high levels of MHC variation when compared with other mammals (e.g., domestic cat [O'Brien and Yuhki 1999], coyote and wolves [Hedrick 2002; Hedrick et al. 2000], pinnipeds [Lehman et al. 2004], domestic dog [Kennedy et al. 2005], 3 vole species [Bryja et al. 2006] and baboons [Huchard et al. 2010; Table 2]).
Balancing selection can act to maintain allelic lineages over long evolutionary timescales (Klein et al. 1998; Takahata and Nei 1990). Genes that demonstrate long-term balanced polymorphisms, in the case of the MHC, often have coalescence times that predate speciation events (Figueroa et al. 1988; Takahata 1990; Takahata and Nei 1990). Our phylogenetic analyses revealed multiple monophyletic clades of alleles among spotted and striped hyenas, as well as cases of transspecies alleles (shared alleles between species). Because no contemporary gene flow exists between these species, we have ruled out hybridization and introgression as the source of shared alleles, suggesting that these alleles were segregating in an ancestral species. The allelic lineages examined here have likely been maintained over extremely long time periods, because these 2 hyena species are estimated to have diverged roughly 8.6 million years ago (Koepfli et al. 2006).
Although some of the alleles shared between striped and spotted hyenas are clearly old (related to each other by deeper branches), other monophyletic clades of intraspecific alleles exhibited shorter branch lengths. These more recent bursts of allelic diversification within some clades of alleles may represent functional diversification, given that many of the substitutions were nonsynonymous (Table 2). Further, if all allelic diversification was exclusively ancient, we would expect to see greater average sequence divergence among alleles than is observed here. Because of the high similarity among some allelic sequences, we hypothesize that allelic diversification is an ongoing process at these loci in hyenas.
Explicit tests for positive selection were highly significant for 2 of 3 loci, even when we incorporated conservative methods that account for the presence of recombination. With respect to these loci (DRB and DQB), the proportion of sites evolving under positive selection is remarkably high, averaging 14% (Table 3). Further, the rate at which these sites are evolving was estimated to be at least 4 times higher than the neutral rate of evolution (DRB: ω = 5.36; DQB: ω = 4.89 [Alba and Castresana 2005; Gibbs et al. 2007; Toll-Riera et al. 2008; Yang and Nielsen 1998]). Interestingly, a disproportionately large number of the codons predicted to be evolving under positive selection correspond to known antigen-binding sites (64% total for both loci together in PAML and 65% for both loci together in omegaMap [Fig. 2]). The fact that rapidly evolving sites correspond to functional sites, even in the presence of recombination, provides further compelling evidence for functional diversification by natural selection at codons that are important for the recognition of pathogens. We were unable to reject neutrality in the DQA locus, so further work will be required to draw firm conclusions about mechanisms of evolution at this locus.
Limitations of inferring selection in the presence of gene duplication.—Clearly, no single conceptual model of MHC evolution can explain all of the patterns found in our data. Selective forces change over evolutionary time, and may not always be mutually exclusive. The conclusions we can draw here are limited by virtue of the fact that we observed considerable gene duplication. Although examination of our data indicated that, on average, positive selection acted on a subset of functionally important codons and negative selection acted on a majority of the remaining of codons at MHC loci in hyenas, we cannot rule out the possibility that both forces also have acted in a more complex manner. For example, it is possible that the signature of positive selection may be due to a subset of rapidly evolving alleles for one of the duplicate copies of DRB, whereas the remainder of DRB alleles experienced negative selection.
If a subset of alleles was responsible for the signature of positive selection, we should have observed nonsynonymous substitutions (dN) that localized to that subset of closely related alleles on the gene tree, but we did not see this. Instead, for each codon predicted to have evolved under positive selection, we found that nonsynonymous mutations (dN) mapped to multiple branches on all plausible trees, and were not exclusive to tip or interior branches. Therefore, although there was no strong qualitative pattern consistent with positive selection acting on only a subset of alleles or gene duplicates, it is important to acknowledge that we cannot rule out more complex patterns of evolution. To address whether particular gene duplicates have unique patterns of evolution, future work will be required to annotate alleles to specific loci. To further validate the selective value of MHC alleles in hyenas, future work in the realm of immunology also will be required to determine whether functional diversification has taken place among these alleles, and to identify the specific immunological challenges influencing selection on these loci in natural populations.
Interspecific comparisons.—Given the number of behavioral differences known to exist between spotted and striped hyenas, we found it surprising that the patterns of molecular evolution we observed were comparable between species. Spotted and striped hyenas did not differ in the identities of codons predicted to be under selection, nor the proportions of sites identified as neutral or under purifying selection pressure. Although we do not have the statistical power to detect small differences in diversity, our data provide strong evidence of shared selection pressure and a shared evolutionary history of alleles between species. In particular, the occurrence of shared alleles between species, and sites under positive selection over the history of those alleles that correspond to known antigen-binding sites, suggest that forces other than sociality were likely important in shaping the evolution of MHC genes in hyenas.
There are many costs associated with sociality, including increased disease and parasite transmission resulting from more contact with conspecifics (e.g., Altizer et al. 2003; Arnold 1990; Bordes et al. 2007; Brown and Brown 1986; Côté and Poulin 1995; Hoogland 1979; Majolo et al. 2008; Molvar and Bowyer 1994). Because of this greater pathogen pressure, and larger effective population size in spotted than striped hyenas (Mills and Hofer 1998), we expected to find much higher MHC diversity in spotted than striped hyenas. Previous work has demonstrated greater MHC diversity in social species than in closely related but solitary-living species (e.g., Hambuch and Lacey 2002; Kundu and Faulkes 2003). However, examination of our data suggests that sociality is not the strongest selection pressure driving diversity in MHC genes in spotted and striped hyenas.
Regardless of other behavioral differences, direct immune challenges stemming from the shared ancestral habit of carrion feeding may be similar between spotted and striped hyenas; we postulate that these may be important determinants of MHC variation. Although more work and larger sample sizes are needed to confirm this, our data are consistent with the idea that MHC diversity is driven more strongly by shared ancestry than by contrasting patterns of sociality or mate preference. The hypothesis that the ancestral habit of carrion feeding selects for high MHC diversity predicts that other carrion-feeding species (e.g., vultures) may have independently experienced strong selection for pathogen resistance, resulting in relatively high MHC diversity. Furthermore, it predicts that MHC diversity in aardwolves (Proteles cristata), which are also members of the family Hyaenidae but never feed on carrion, should be lower than in the carrion-feeding hyenas.
Acknowledgements
We thank the Kenyan Ministry of Education, Science and Technology; the Kenya Wildlife Service; Narok County Council; the Senior Warden of the Masai Mara National Reserve; Loisaba, Mpala, and Kisima ranches; and the Laikipia Predator Project. This work was supported by National Science Foundation IOB 0618022, IOS 0819437, and IOS 1121474 to KEH, and graduate research fellowships from the National Science Foundation, Michigan State University, and Sigma Xi to KJC.
Supporting Information
Supporting Information S1.—Summaries for all omegaMap analyses for spotted (Crocuta crocuta) and striped (Hyaena hyaena) hyena major histocompatibility complex DRB sequences.
Found at DOI: 10.1664/12-MAMM-A-054.S1
Supporting Information S2.—Summaries for all omegaMap analyses for spotted (Crocuta crocuta) and striped (Hyaena hyaena) hyena major histocompatibility complex DQB sequences.
Found at DOI: 10.1664/12-MAMM-A-054.S2
Literature Cited
Author notes
Associate Editor was Matina C. Kalcounis-Rueppell.
